Portfolio Information
Managed Portfolio Size, Geographic Spread and Make Up
The GLA of Cenprop’s managed portfolio is in excess of 300 000m² which is spread nationally over the main urban hubs, incorporating strategic less accessible areas such as: Upington, Phalaborwa, Hluhluwe, Esikhawini and Welkom. The portfolio is dominated by retail properties, with a complement of office properties and a small industrial property sector. Speaking in terms of GLA, the retail element of our portfolio is evenly split between Gauteng and Kwa-Zulu Natal, with a substantial offering in the Western Cape and smaller offerings in other provinces. Certain notable managed properties in our portfolio include Alberton Lifestyle Centre in Johannesburg, Phalaborwa Mall in Phalaborwa, and Fountains Regional Mall in Jeffrey’s Bay.
Graphical representations of the makeup of the portfolio are as follows:
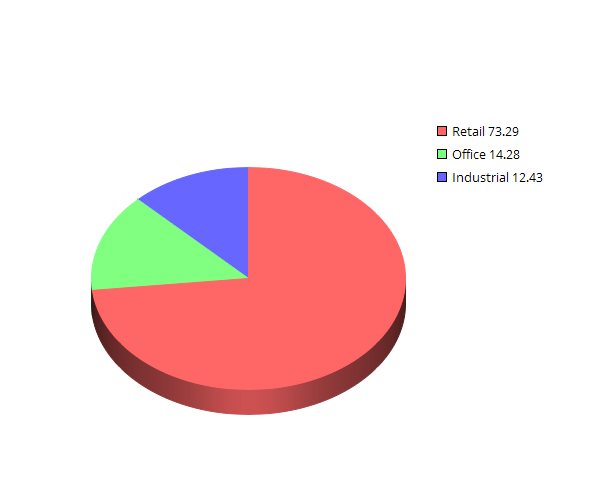
| Managed Portfolio by Sector | ||
| Sector | GLA (m²) | % Makeup |
| Retail (73.29%) | 231,300.32 | 73.29% |
| Office (14.28%) | 45,077.40 | 14.28% |
| Industrial (12.43%) | 39,223.50 | 12.43% |
| Total | 315,601.22 | 100.00% |
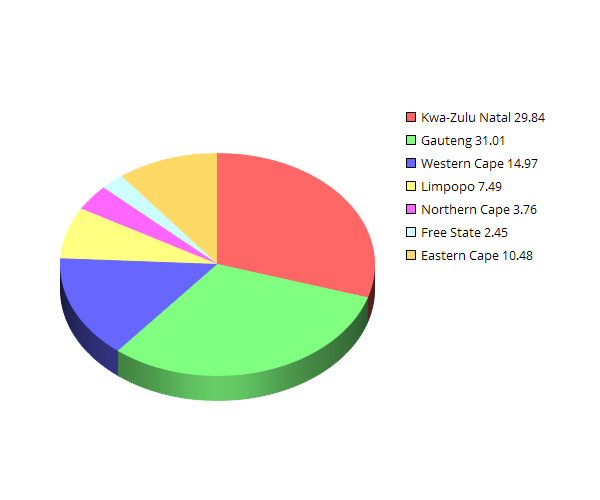
| Managed Portfolio by Region | ||
| Region | GLA (m²) | % Makeup |
| Kwa-Zulu Natal (29.84%) | 94,173.36 | 29.84% |
| Gauteng (31.01%) | 97,858.17 | 31.01% |
| Western Cape (14.97%) | 47,251.97 | 14.97% |
| Limpopo (7.49%) | 23,644.91 | 7.49% |
| Northern Cape (3.76%) | 11,860.23 | 3.76% |
| Free State (2.45%) | 7,726.57 | 2.45% |
| Eastern Cape (10.48%) | 33,086.00 | 10.48% |
| Total | 315,601.22 | 100.00% |